AWS – IAMAWS – EC2AWS – Load BalancerAWS – Route 53AWS – RDSAWS – AuroraAWS – ElasticacheAWS – S3AWS – CloudFrontAWS – LambdaAWS – API GatewayAWS – DynamoDBAWS – KMS and EcryptionAWS – SQSAWS – SNSAWS – SESAWS – ElasticBeanstalkAWS – Elastic Container Service(ECS)AWS – KinesisAWS – CodecommitAWS – CodeBuildAWS – CloudFormationAWS – CodeDeployAWS – CLIAWS – CodePipelineAWS – CloudWatchAWS – AlexaAWS – Secrets ManagerAWS – Kubernetes on AWS
AWS – CloudWatch
Amazon CloudWatch is a monitoring service for engineers.. CloudWatch provides you with data and actionable insights to monitor your applications, respond to system-wide performance changes, optimize resource utilization, and get a unified view of operational health. CloudWatch collects monitoring and operational data in the form of logs, metrics, and events, providing you with a unified view of AWS resources, applications, and services that run on AWS and on-premises servers. You can use CloudWatch to detect abnormal behavior in your environments, set alarms, visualize logs and metrics side by side, take automated actions, troubleshoot issues, and discover insights to keep your applications running smoothly.


CloudWatch performs 4 actions normally, first it collects log and metric data, then monitors the applications, then Acts according to the instructions, finally analyzes the collected log and metric data for further usage.
Events
AWS CloudWatch indicates a change in your environment. You can set up rules to respond to a change like a text message sent to you when your server is down.
Alarms
CloudWatch Alarms are used to monitor only metric data. You can set alarms in order to take actions by providing a condition in the metric data of a resource. Consider the CPU Utilization of the EC2 instance can be upto 75% and an Alarm should be evoked once it crosses the range.
There are 3 alarm states:
- OK – Within Threshold.
- ALARM – Crossed Threshold.
- INSUFFICIENT_DATA – Metric not available/ Missing data (Good, Bad, Ignore, Missing).
One of these states will be considered at each millisecond of using CloudWatch metric data
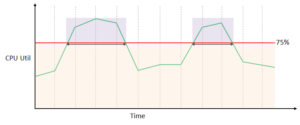
- When the CPU Utilization is 75% or lesser than 75% the Alarm state is at OK
- If it exceeds it is at ALARM you will notified
- Whenever there is no CPU Utilization data or incorrect data is produced, it will be called INSUFFIECIENT_DATA
Tail a log group from your computer. At the time of this writing, I am using aws cli v2.
- Open command line
- Get group name. Log groups are found under Cloudwatch service under Logs or run this command on the AWS CLI
-
aws logs describe-log-groups --log-group-name-prefix /ecs
The command above get all the log groups in the /ecs aws service. Here it will get all of the server log groups on ecs.
- Use the aws logs tail command
aws logs tail {log-group-name} --followExample – log api server on ecs
aws logs tail /ecs/backend-api --follow --format short
AWS – IAMAWS – EC2AWS – Load BalancerAWS – Route 53AWS – RDSAWS – AuroraAWS – ElasticacheAWS – S3AWS – CloudFrontAWS – LambdaAWS – API GatewayAWS – DynamoDBAWS – KMS and EcryptionAWS – SQSAWS – SNSAWS – SESAWS – ElasticBeanstalkAWS – Elastic Container Service(ECS)AWS – KinesisAWS – CodecommitAWS – CodeBuildAWS – CloudFormationAWS – CodeDeployAWS – CLIAWS – CodePipelineAWS – CloudWatchAWS – AlexaAWS – Secrets ManagerAWS – Kubernetes on AWS